Metaverse Index Monthly Update - January 2022
January saw the continuation of the December price action as macro headwinds battered crypto and legacy markets. Persistently high inflation led the market to price in 4 interest rate hikes from the Federal Reserve in 2022 and the removal of quantitative easing. We won’t get into inflation, monetary and fiscal policy, and politics here. Still, you should check out this article by Arthur Hayes and our latest episode of Probably Nothing for more on this subject. The end result here is a major sell-off in risk assets with BTC trading similar to high growth, unprofitable tech stock.
The Metaverse Index, MVI, continued to underperform BTC given it’s even further out on the risk curve than BTC. In December, MVI returned -29.4%, compared to -16.8% for BTC and -27.1% for ETH. Since its inception, MVI has continued to outperform ETH and BTC by 28.3% and 89%, respectively.
Stats and sats
Risk metrics remain largely unchanged. MVI’s correlation to ETH and BTC is the same as last month, at 0.73 and 0.66 since inception. The MVI’s beta is currently at 1.10 for ETH and 1.35 for BTC. Net capture ratios remain positive, although they have been trending down over the last couple of months. For BTC, the net capture ratio is currently 38.2%, while for ETH, it’s sitting at 11.8%.
The growth in the number of unique addresses holding MVI stagnated in January, up just 3%. At the same time, MVI holders on Polygon grew at a healthier 30% clip. Altogether, we added 337 holders on Ethereum for a total of 10,170 holders and 962 holders on Polygon for a total of 4,151. As we mentioned previously, we are not able to determine the level of actual address overlap between Polygon and Ethereum. The Polygon bridge continued to lock up MVI, with its share of circulating supply increasing from 4.5% to 5.2% in January.

While the holder growth remained healthy despite the sell-off, unit growth turned negative. Circulating units fell 6.6% in January, with a total of 186,719 units circulating at the end of the month.
It’s worth going a bit deeper into what drives unit mint and redeem volumes for MVI or any other index for that matter. There’s some organic volume, of course, but most mint and redeem transactions are done by arb bots to bring the market price in line with the net asset value (NAV). The cost of a mint, for example, is much higher than a simple buy transaction. This is because a mint involves buying all of the underlying tokens on a DEX and minting a new unit. So it’s a bunch of transactions bundled into one for the user’s convenience. When the market price on Uniswap deviates significantly from NAV, it becomes profitable to arb it back to NAV, even after the high transaction cost.
Now, what leads to the deviation of market price from NAV? Most often, it’s the demand for the token. Because NAV is calculated as the weighted-average price of the underlying tokens, high buy or sell volume for MVI, not the underlying tokens, will push the market price above or below NAV.
When the market price is above NAV, it makes sense to mint new units at NAV and sell them at market price. On the other hand, when the market price is below NAV, buying on the market and redeeming at NAV is the way to make a profit.
This brings us to the final point – liquidity. If liquidity for MVI is very shallow, it doesn’t take all that much buying or selling to move the price away from NAV. This works both ways. When there’s a lot of hype around the Metaverse narrative, buying pressure leads to many new units being minted. But when we are in the bearish environment, arb bots turn to redemptions. As you can see below, the liquidity for MVI has been getting worth and worth, which invariably leads to exaggerated mint and redeem flows.

Alright, apologies for the detour. Looking at the trading volume, things have continued to trend down. From an average of $2.5m per day in November to $1.05m in December, we saw about $0.54m in January. Total trading volume for the month was close to $17m.
Portfolio performance
Only 2 tokens in MVI, NFTX and DG, escaped the down market this month at the portfolio level. NFTX was up an astonishing 61%, while DG was pretty much flat, up about 1.5%. AXS, WHALE, AUDIO, TVK, WAXE, ILV, YGG and ERN were some of the worst performers, down between 36.9% and 46.5%.
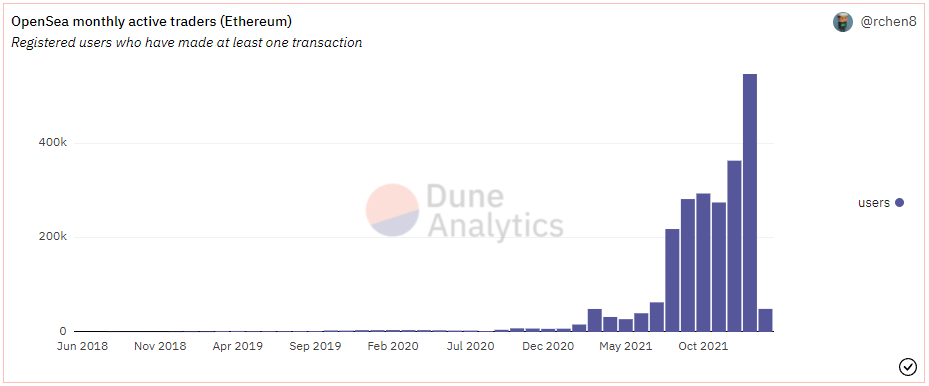
Talking about NFTX, what a month! NFTX benefited from a combination of macro and project-specific developments as well as what we might call a composability bonus. On the macro, NFTs held up remarkably well during the sell-off. In fact, OpenSea had its highest volume month ever, with monthly users up 51% from the previous all-time high as well. Furthermore, in ETH terms, floor prices of many collections went significantly higher. As the liquidity protocol for NFTs, NFTX benefited from the strong performance and sentiment around NFTs.


Looking at the project-specific news flow, NFTX released inventory staking in January. This feature is fantastic! It allows users to deposit their floor-priced NFTs into an NFTX vault and stake their position for a share of all fees. Previously, only liquidity providers for NFTX vault tokens received protocol fees, but with inventory staking, 20% will flow to, basically, single-sided stakers that don’t want to take on impermanent loss risk. As a reminder, NFTX charges mint and redeem fees on its vaults. Over the last 30 days, NFTX generated $1.3m in fees, according to Dune Analytics, with the majority of that coming from target swap, target redeem and mint fees.

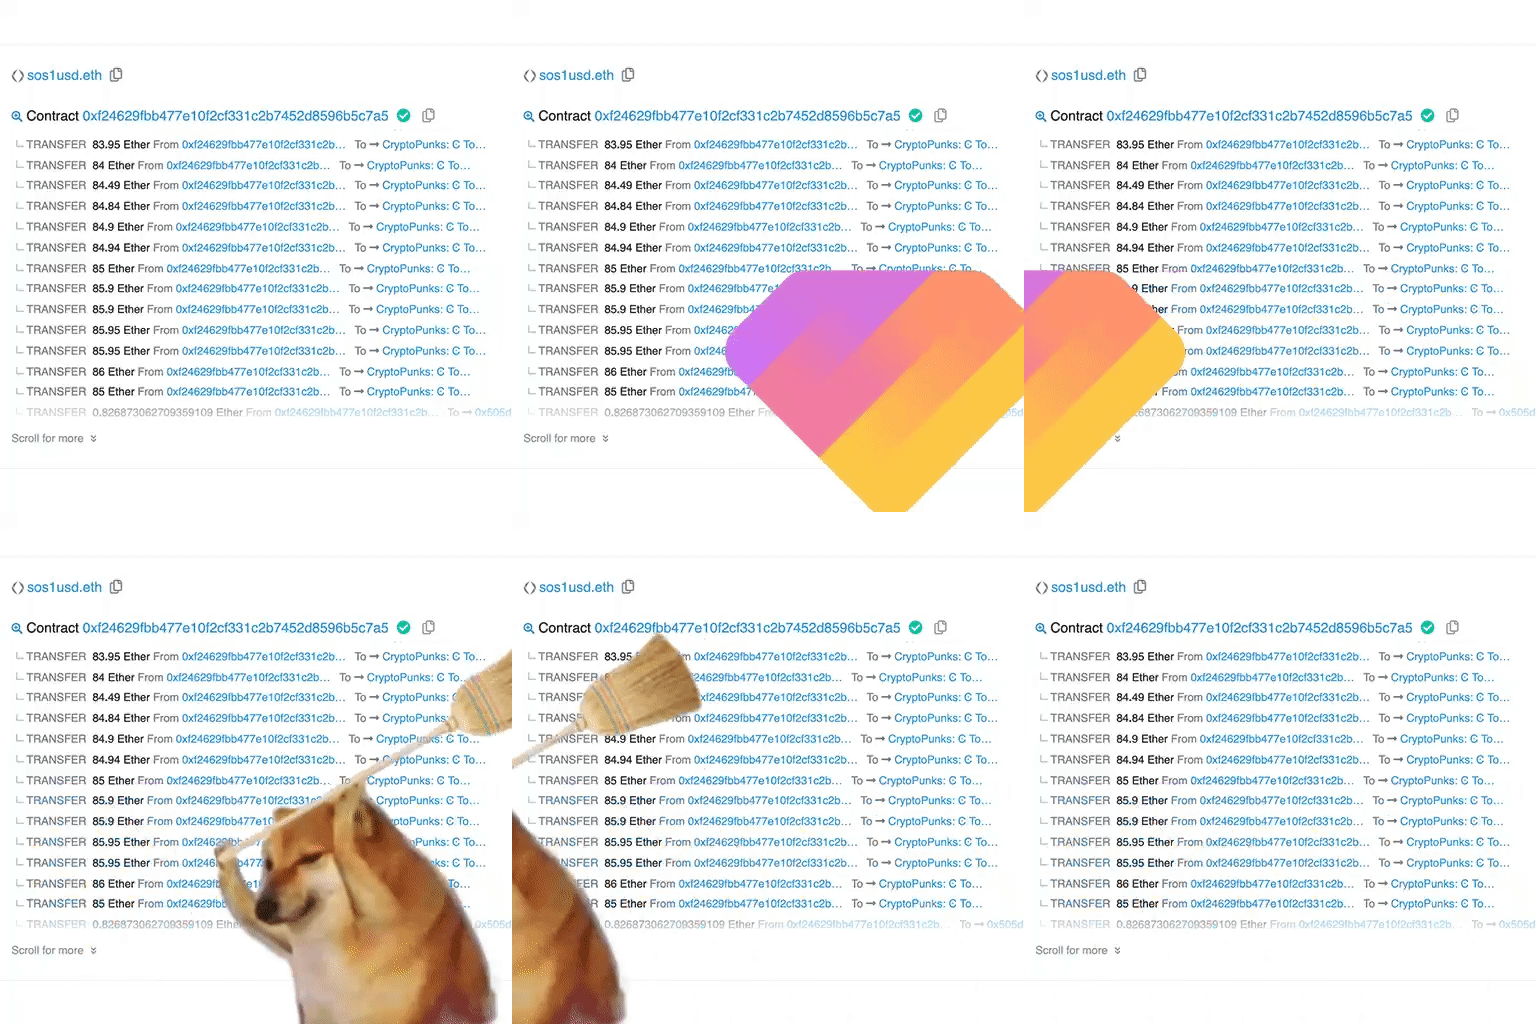
Alright, what about the composability bonus? Composability bonus is only possible with open-source technology and, in the case of NFTX, refers to other protocols utilising NFTX in their design. For instance, an NFT Aggregator gem.xyz is allowing people to easily sweep the floor of a collection. Because NFTX vaults mostly have floor NFTs, some of that floor-sweeping might involve target redemptions from an NFTX vault. Just like this 20 CryptoPunks sweep for 1683 ETH.


The second example of the composability bonus for NFTX is FloorDAO. FloorDAO is essentially looking to bootstrap a treasury full of NFTX vault tokens and liquidity positions. If it works, this will significantly increase the liquidity of tokenised NFTs, benefiting both buyers and sellers. You can check this thread to peek into the future.

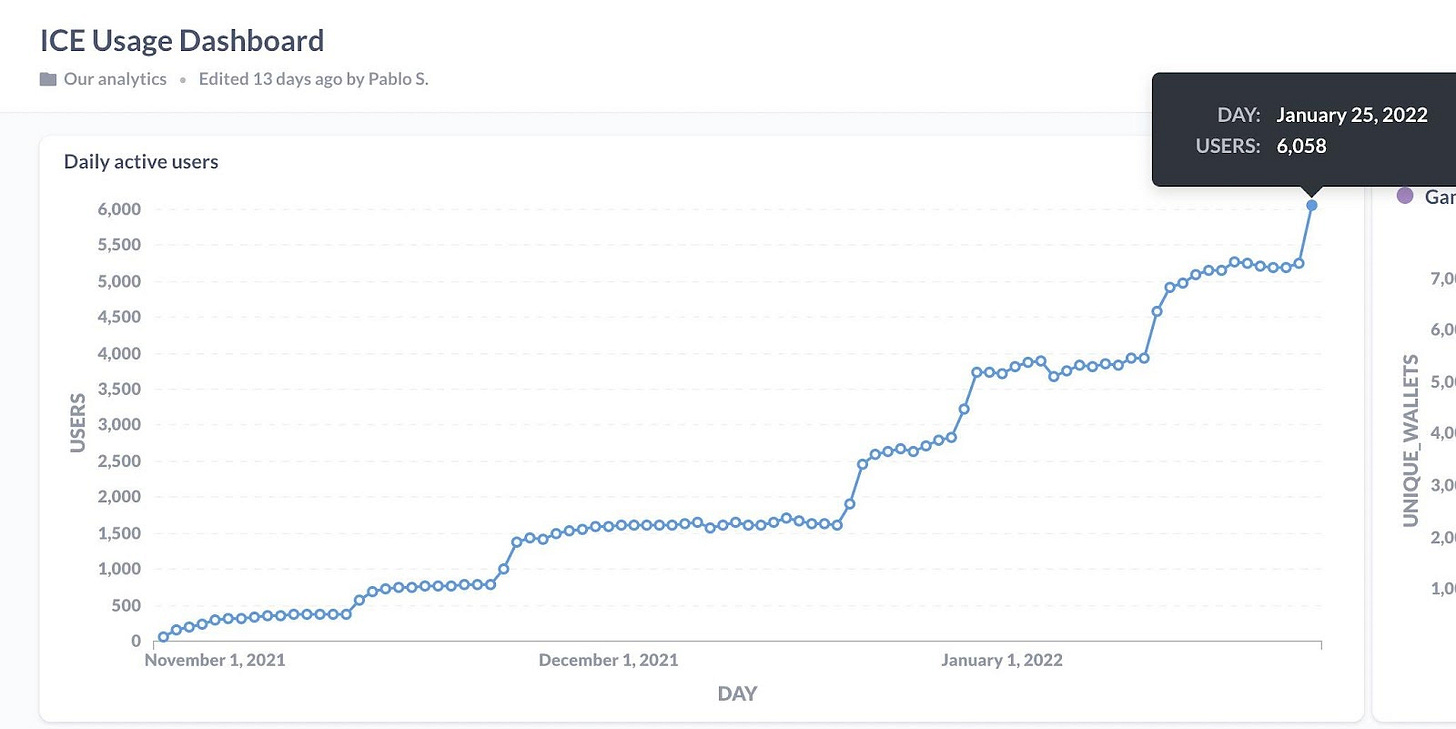
DG is another token that held up really well in January, outperforming the market. To be honest, we can’t really do DG justice without writing an entire piece on it and its ICE poker. But let’s just run through some numbers real quick. The user activity has picked up significantly over the last couple of months, hitting 1,000+ concurrent players and 6,000 DAUs (record 1,380 concurrents).

The team recently added streaming support for its casinos, including video, audio, and images. The idea here is that approved companies can place content in DG’s poker lounges, either burning ICE or paying $DG for the pleasure of doing so. As a reminder, DG’s venues consistently rank in the top destinations in Decentraland.
With ICE wearables sales, secondary market royalties and NFT activation/upgrades, Decentral Games are generating substantial revenue for the Treasury. The latest ICE wearable sale, for example, brought in $2.3m, of which the majority was converted to DAI, and some went to buying DG on-market and providing liquidity to the DG-ETH pair. It looks like secondary market activity is hitting about 1,000 ETH per week, generating 4.9% royalty. The team continues to release new wearables, and with secondary prices far above the mint cost, it appears that demand significantly exceeds supply. As for the NFT activation/upgrades, over the last two weeks, DG brought in about $100k and $115k from these activities. No wonder the token price held up despite the market sell-off!
Sticking with non-fungibles, throughout January, both crypto and mainstream news outlets heavily featured NFTs. Celebs continued to buy into projects like Bored Apes & Doodles, marketplace volumes surged (see OpenSea graph above), and new communities emerged all around. Instagram and Facebook announced that verified NFT pfps will soon arrive on their platforms, with a longer-term view to building NFT marketplaces. This was all ammo for the Rally team, who covered this news and more while adding a slant to make it relevant to their platform. However, all the attention didn’t much help the token price, as RLY sank -32.6% during the month.
Price aside, Rally laid out their priorities for 2022, including plans to go multi-chain, a progressive move to community ownership, onboarding more creators and focusing on metrics to drive growth.
They immediately delivered on the multi-chain initiative with SuperLayer (the web3 venture studio of Rally) announcing they will launch tokenised consumer products on Solana. This move will focus on the larger-scale initiatives that a cheap and high throughput chain, like Solana, enables. It’s slated to include things like tokenised social networks and play-to-earn games and will be complemented by the introduction of RLY token liquidity on Solana.
To cap off a solid start to 2022, RLY was also listed on Gemini. The token is now widely available at top tier exchanges, including Coinbase and crypto.com, and has decent DEX liquidity (great for $MVI!).
Closing Thoughts
January was a busy month for MetaPortal. We kicked off our Discord (join here), started two new content series, Metaverse Inc. and the crypto gaming weekly round-up, and continued to move forward with the launch of $GAME, our second index product. In terms of content, we published two episodes of the Probably Nothing podcast, a MetaPortal podcast episode with Tin Nguyen from Sipher, two weekly crypto gaming round-ups, an opening article of the Metaverse Inc. series, a couple of the “Metaverse Primer” recaps and a few more things. Busy month indeed.
Last but not least, there are no inclusions or removals for this month’s rebalance. We have made some tweaks to the index this month, freezing the weight of RARI, for example. This is due to extremely low liquidity for tokens like RARI and REVV. Ideally, we would like to exit these positions. However, current market conditions make it somewhat challenging, so we will take a gradual and measured approach here.


